Resources
This was my final year dissertation project at University. Having just spent a year helping develop games, I wanted to understand the factors influencing the success of early-access products with living development cycles reliant on user-feedback. It was an opportunity to learn more about data-science, and combine my passion for gaming with web development.
My hypothesis was that early-access games with a higher cadence of updates incur higher review scores and player-count prior to full commercial release, creating a positive feedback loop of common success metrics. By validating this information, I could help improve decision-making during development.
Doing the project gave me experience:
- Building and deploying microservices
- Working with message buses
- Working with NoSQL databases and their indexing, clustering strategies
- Processing large data-sets
- Academic research and writing
- Exploring, visualising data and validating my findings
Abstract
“[My] paper covers the construction of a data-mining architecture sufficient to explore the software development lifecycle using engagement data, and furthermore quantifies some relationships between metrics during this time period.
Research is conducted towards … the practical application of business strategy in the context of the video games industry.
Through statistical analysis it is outlined that the data … can be used to both classify the type of ‘story’ a specific product has, and tune the process of active development to maximise the success criteria of a project.
The insights derived from analysis are placed into an industrial context through an evaluative survey, and intended to be used as a catalyst to provide teams undertaking rapid prototyping with justification and context for their decisions, with further application in predictive modelling.”
Technology
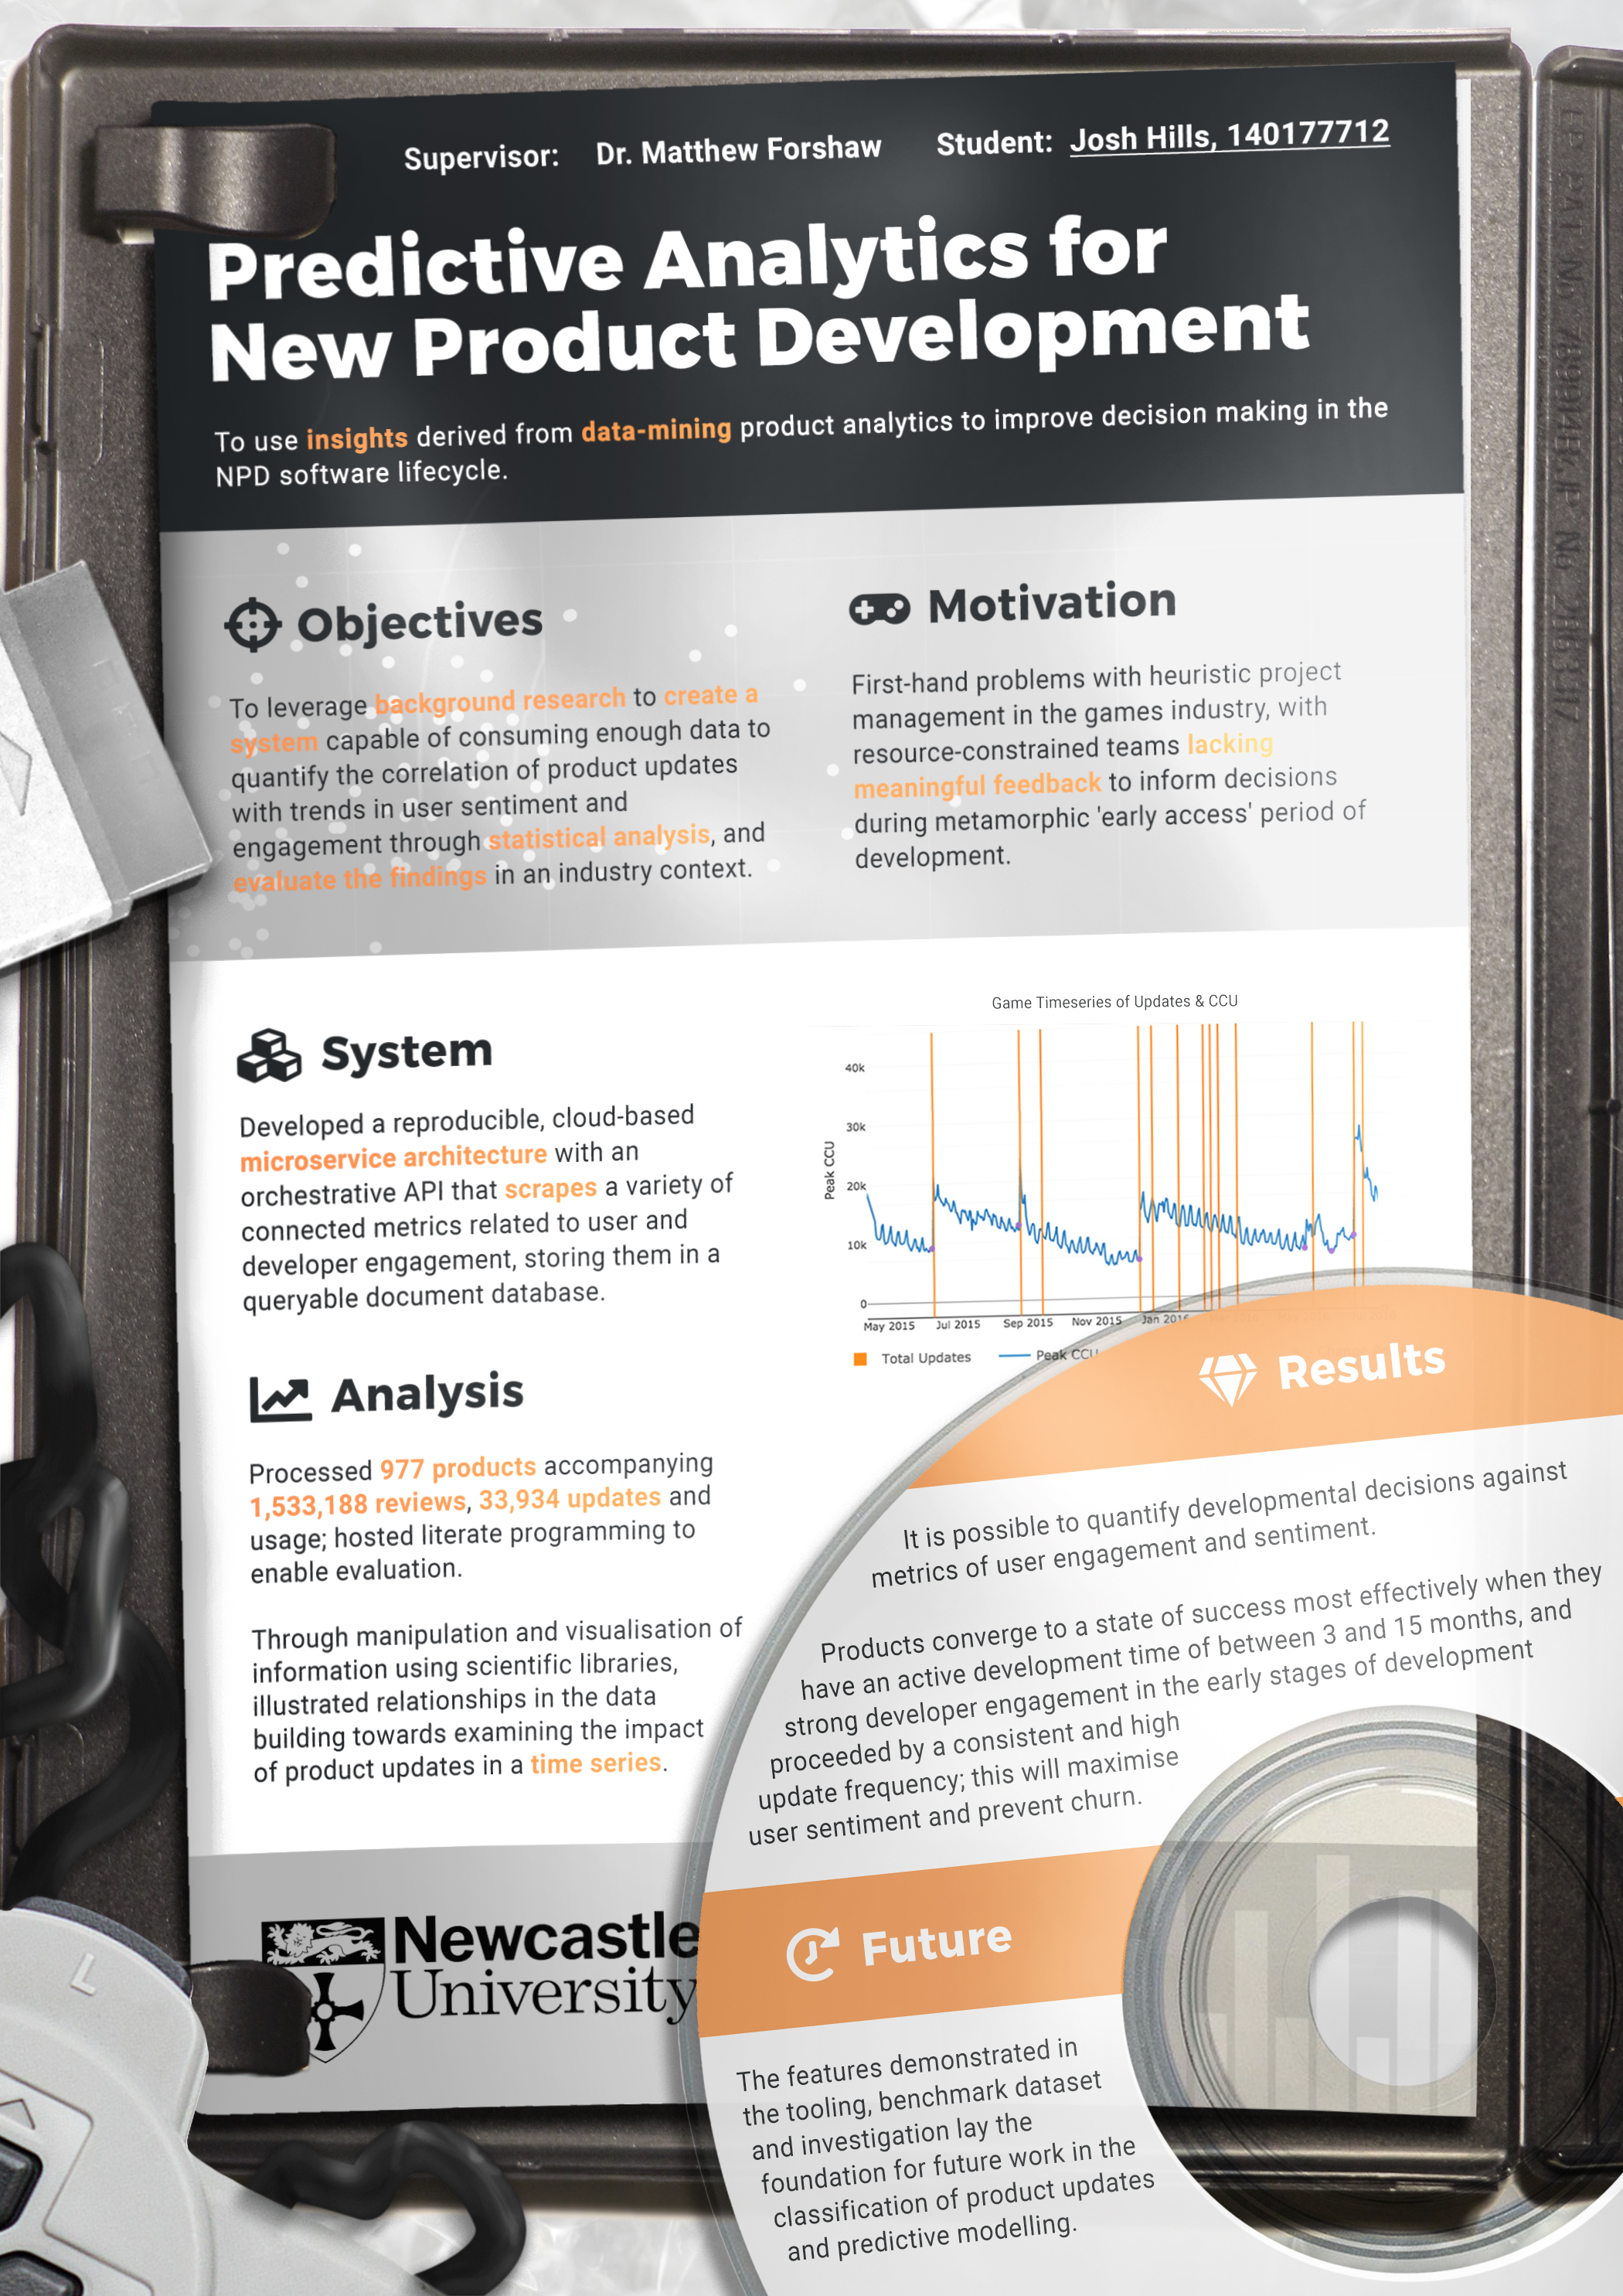
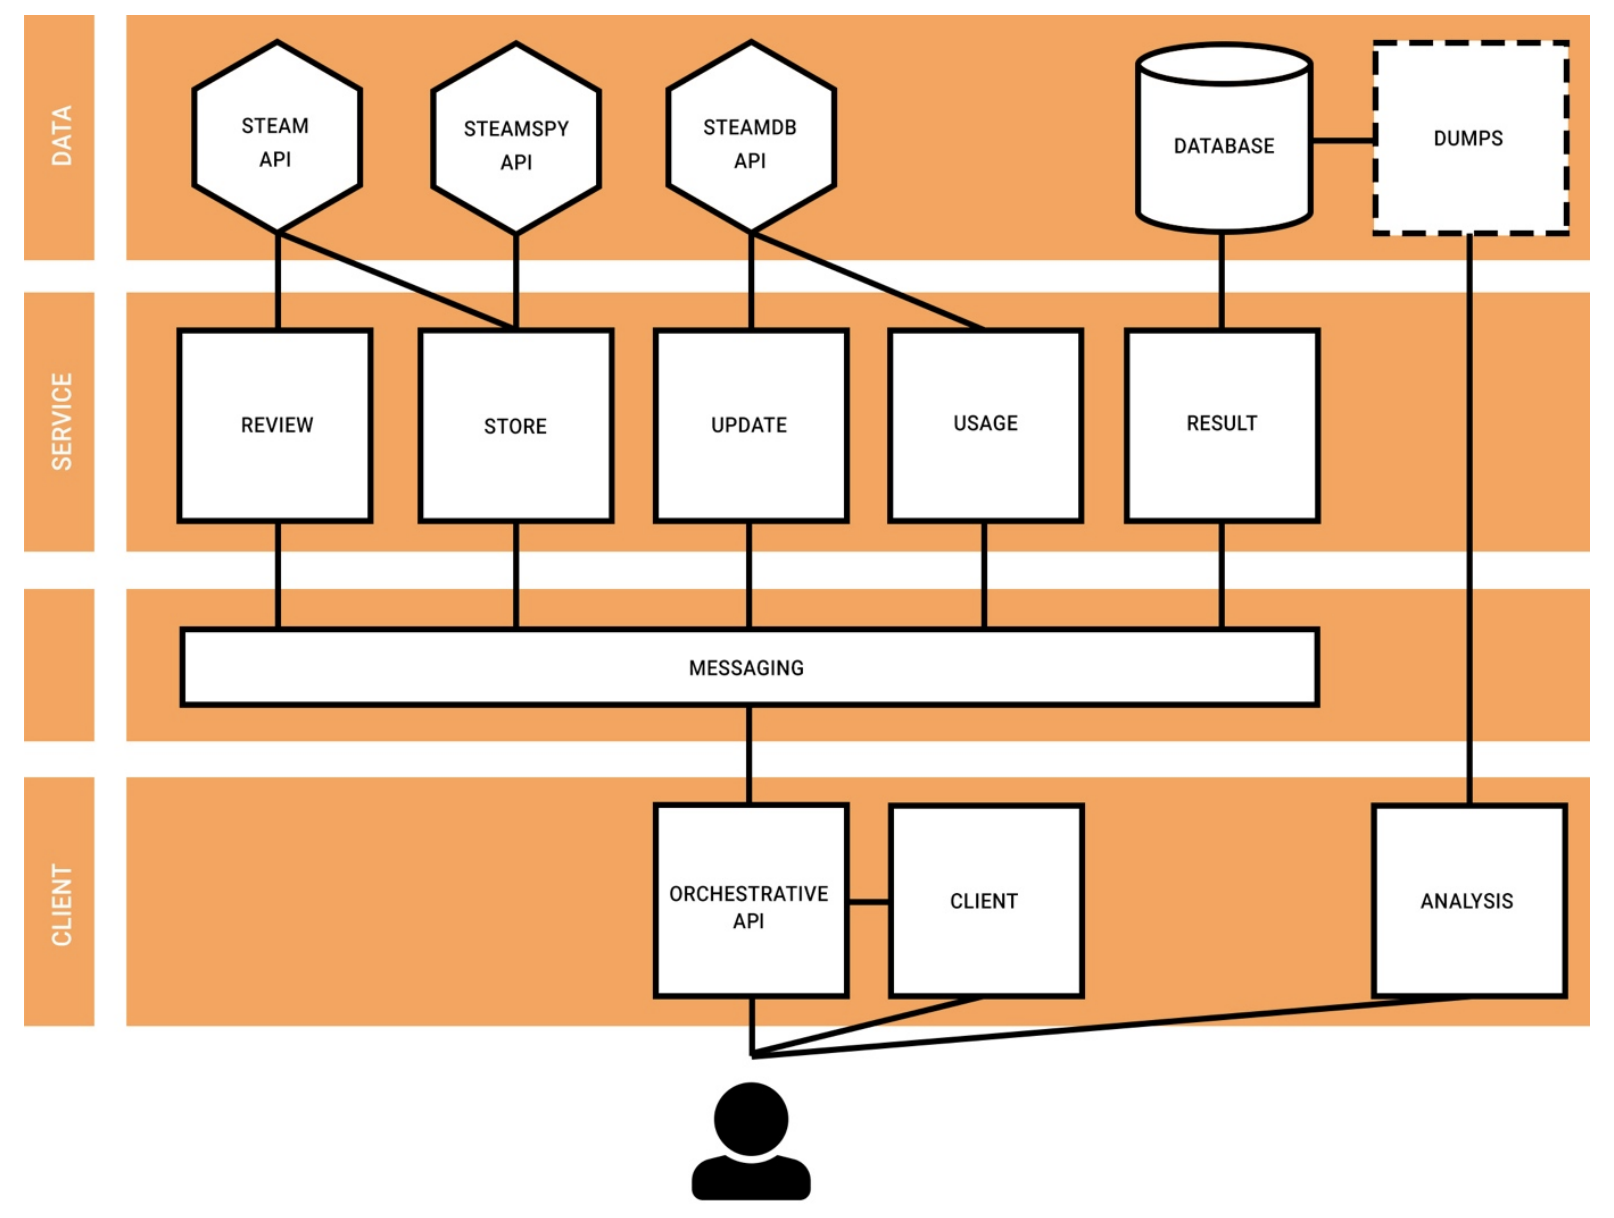
I built a data ingest pipeline using Python (Flask), Couchbase and RabbitMQ with which I could scrape information about Steam games tagged as “early-access”. The pipeline drew from a number of public APIs to retrieve information about CCU, user reviews and content-updates. When this was deployed (DigitalOcean), I used Jupyter to explore and graph the data for my paper.
Results
Using this pipeline, I retrieved information about 977 games, with a total of 1,533,188 reviews. In short, although there were some ambiguities noted, with an evidenced understanding of factors influencing the success of previous ‘early access’ products, developers could use the results in order to plan their own release strategy. This may remove uncertainties in the process, e.g.
- The length of development time preceding a full release
- The release schedule of updates throughout the lifecycle
- Specific qualities in users to target for better feedback
In the examination of user feedback
On average, 8% of reviews per product are submitted by users who have received the product for free, with software and casual game product genres receive the highest proportion of free copies (6% and 4% respectively).
- For the 78.2% of products with reviews left by users who received the product for free, those reviews were 5% more biased towards positivity.
- For products that can be ‘completed’, the most ‘useful’ end ergo top reviews as voted by the community are left by users that have a logged time that correlates with the expected completion time for the product. For open-ended products, there is no strong correlation between the total usage and helpfulness of reviews, however the most useful reviews are left by users who have spent at least 6 hours using the product.
- Top reviews per product are slightly biased towards positivity in total, with 603 (~62%) of top reviews being positive, and 374 (~38%) being negative.
- Although 70% of top reviews agree with the majority of other users having left reviews for that product, the outliers that disagree are significantly (~820%) more likely to be negative
- User sentiment is more positive at the beginning of a product’s lifecycle, and almost product’s user score wanes over time.
- The majority (~75.8%) of all reviews are positive. The ‘true user score’ computed from this is more positive than the one reported by the platform, which implies that reviews left by users who acquired the product outside of the platform are more favourable.
In examining the link between developer engagement and user sentiment
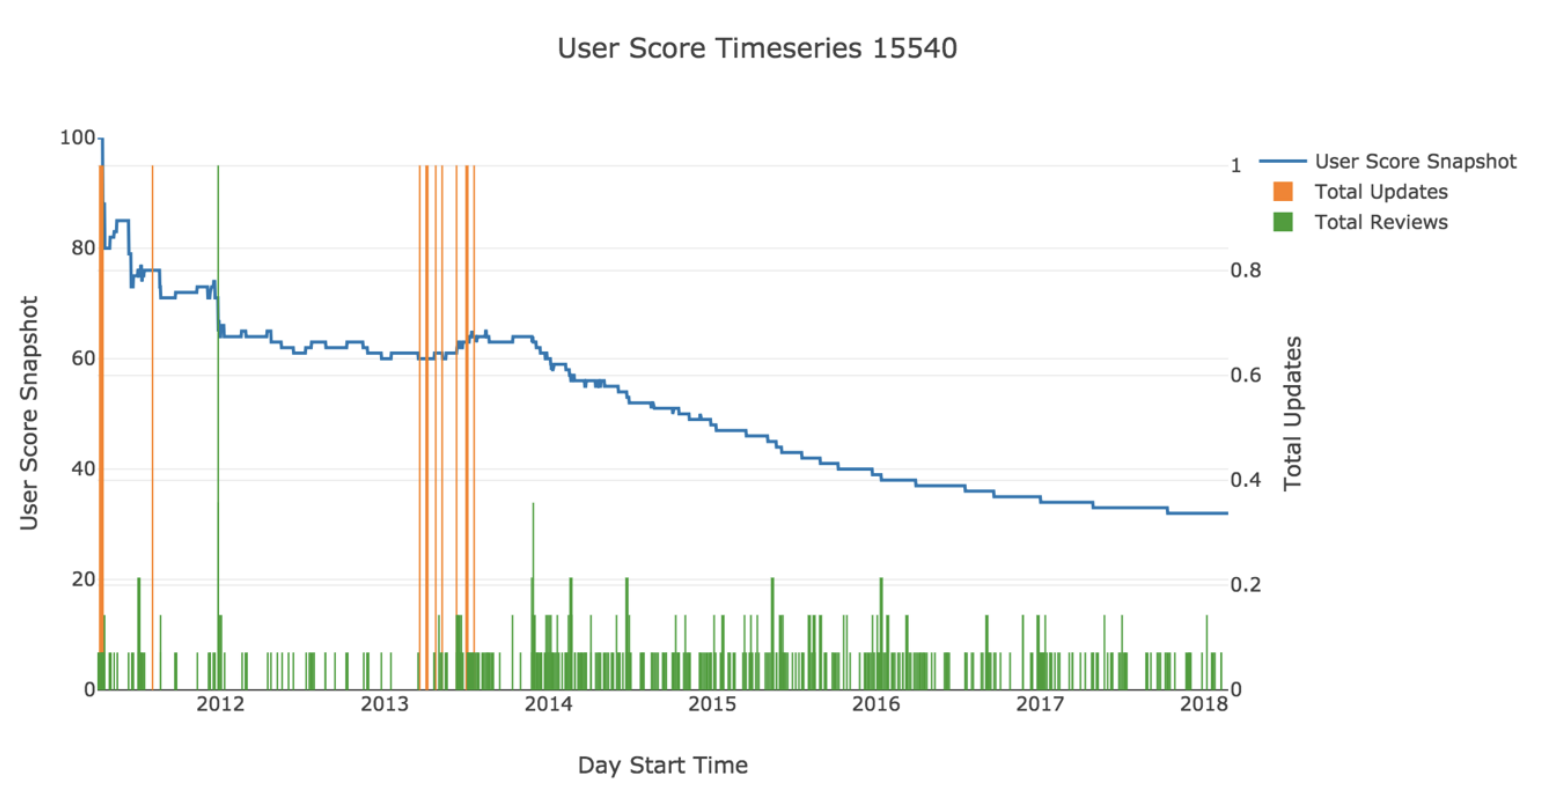
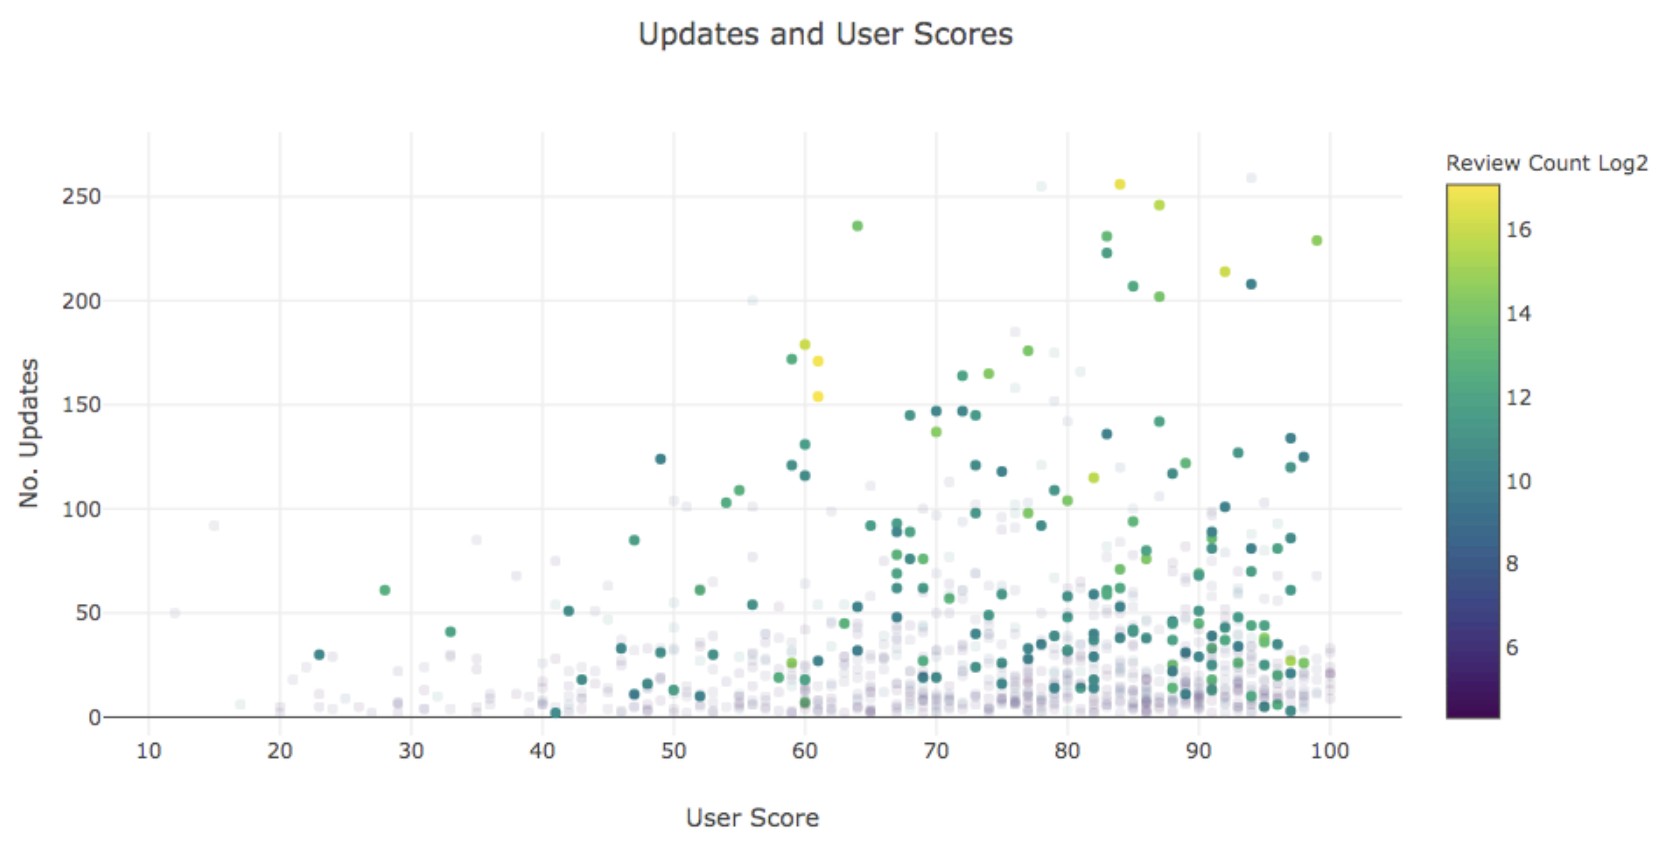
While a higher total of updates is not necessary to achieving a positive user score, products that have a larger number of updates logged receive more positive recommendations. All products with more than 125 updates have a user score higher than 50 (positive), and conversely, products scored negatively rarely reach more than 100 updates.
- Most products drop in user score over time. They all exhibit uncertainty at the start of their cycle, beginning high and then entering a period of fluctuation where updates are the most impactful. Most products do not largely deviate from the user score they have at the midpoint of their release cycle, and ~10% did not change at all from this point.
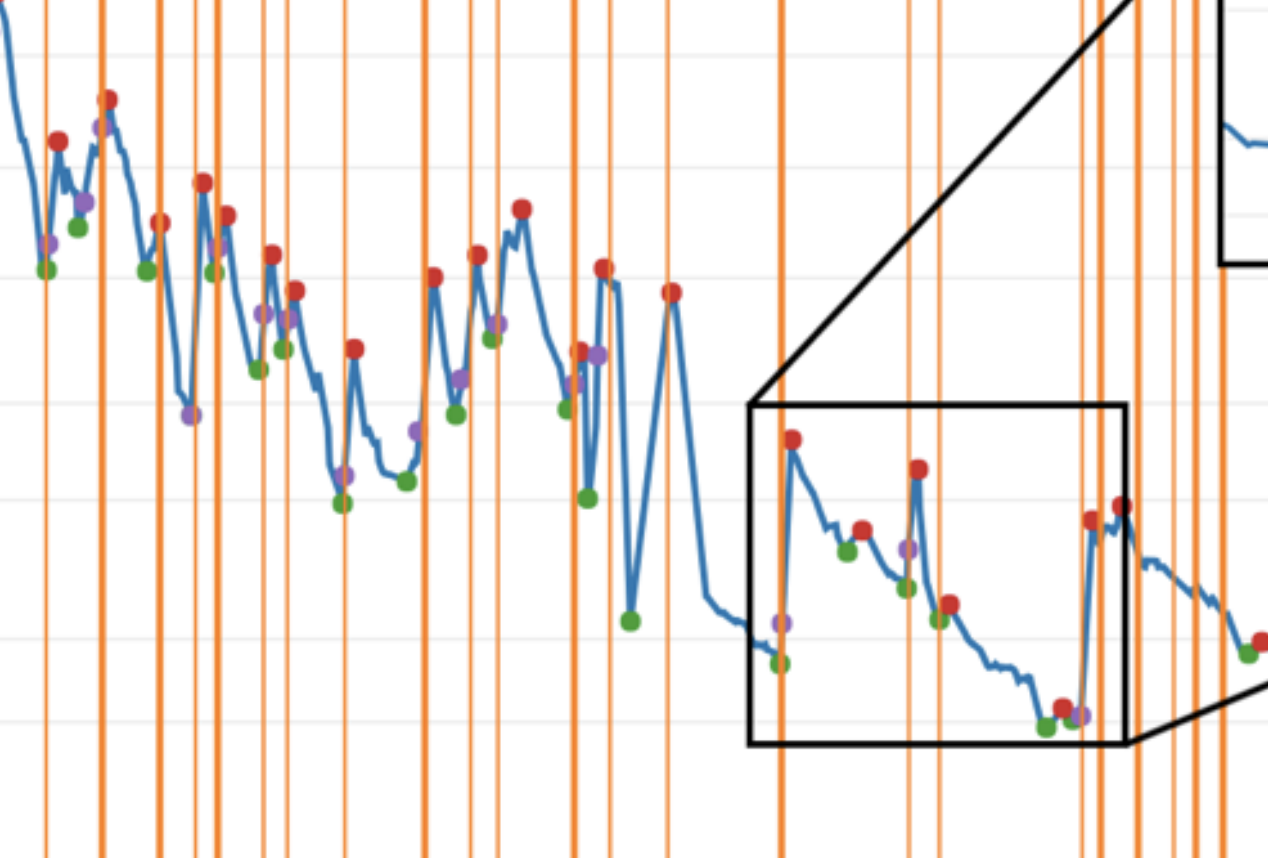
- Product updates appear to be capable of increasing the user score of a product, with positive sentiment mostly achieved through clusters of updates.
- Frequent product updates appear to uphold a user score, preventing it from dropping.
- The average active development span for products is 16.1 months, and the optimal length appears to be between 3 and 15 months. Longer timeframes than this result in a drop in sentiment.
- Periods without updates correlate with a drop in user sentiment.
- ‘Abandonment’ and ‘completion’ can be classified using a combination of user score and updates over time.
In examining the link between developer and user engagement
- Most products remain relatively unseen, with the median for max peak daily CCU forever being 54.
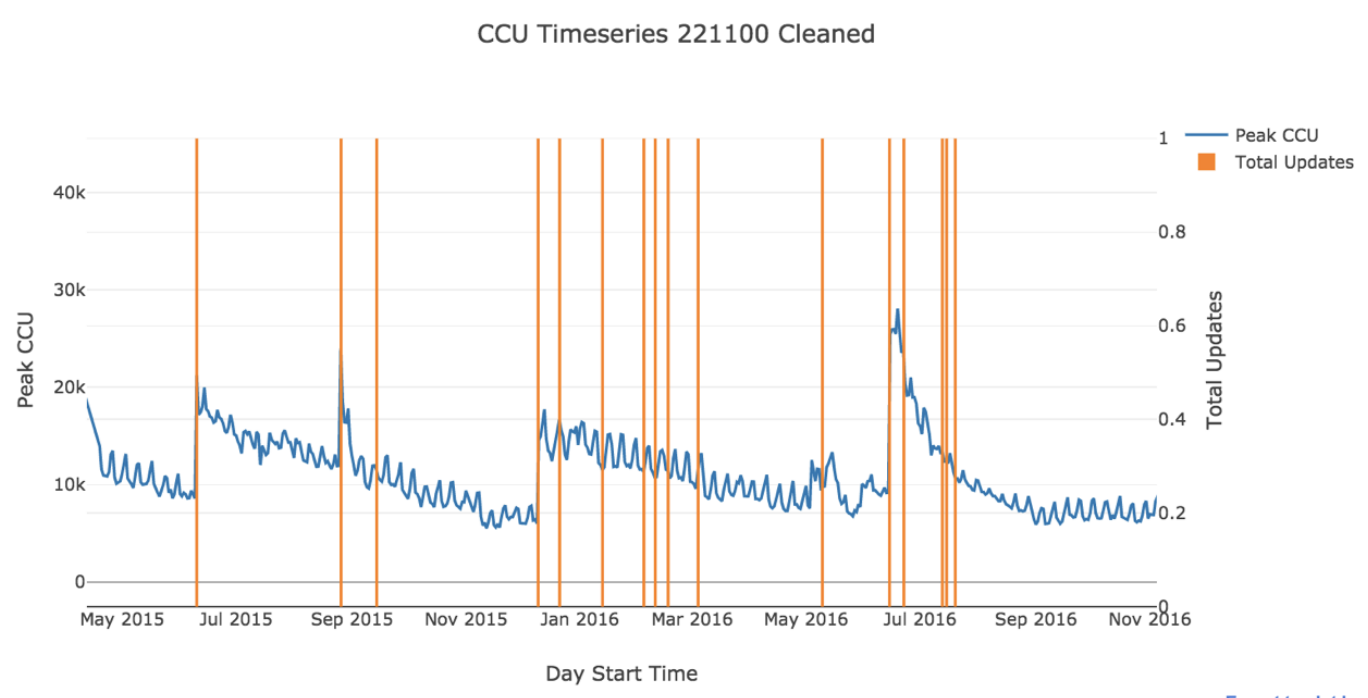
- There is a slight trend towards higher CCU for popular products with a greater update frequency versus popular products with a lower update frequency.
- Product updates correlate with positive changepoints (spikes) in CCU, and demonstrate a lasting effect that appears to combat churn for a period of time. Quantifying this for a popular non-linear product sees an average uptick of ~35% increase in the current CCU per time of update. While this is fairly consistent over time, the absolute impact diminishes in tandem with churn.
Feedback
At the end of the project, I presented my findings at a fair and sought feedback from a senior data scientist in the games industry:
“For the first time this large dataset could provide answers to some … questions.
The findings are in many cases a validation of my pre-existing expectations, which is valuable both as a reassurance that our existing and less formal or objective domain knowledge that we have been using to make decisions is accurate, as well was providing a methodology to maintain an objective view on the continued truth of this.
We could use [the] findings to make fundamentally different decisions about the path of product development/release based on early metrics.”
To conclude, I met all of my objectives and gained some valuable insights. It appears to present a good springboard for future investigations.
